Innovative 3D mapping aids Fukushima decommissioning
Japan Atomic Energy Agency (JAEA) has innovatively integrated Kaarta Stencil-2 with a special camera to visualise radioactive substances in three dimensions.
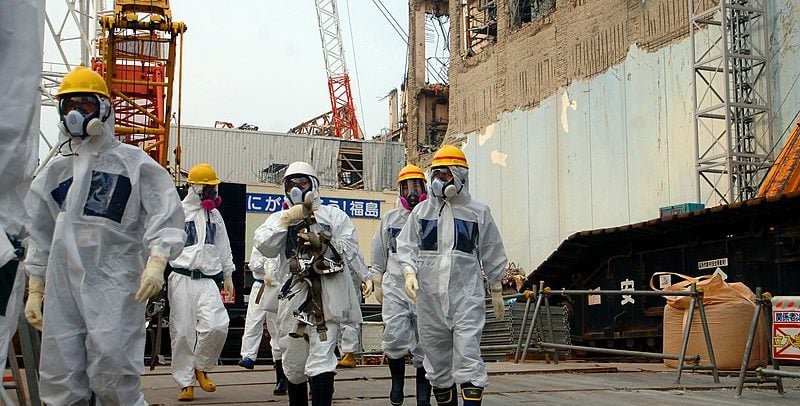
In 2011, the Tohoku earthquake and tsunami triggered the Fukushima Daiichi nuclear disaster in Fukushima Prefecture, Japan. The worst nuclear accident since Chernobyl, the tragedy saw core meltdowns in all three reactor units as a result of the loss of coolant and failure of the generators that ran the pumps. Among the many catastrophic incidents, there were hydrogen explosions and the release of radioactive contamination. Since then, ongoing efforts have been made to decontaminate the three nuclear reactors, work that is anticipated to last for decades.
Understanding radiation distribution
It is essential to understand radiation distribution in the decommissioning work to effectively reduce radiation exposure and decontaminate the area. Contaminated areas must be identified in three dimensions to accurately understand the distribution. However, conventional methods, such as radiation meters or gamma cameras, provide only point or surface measurements. It is very difficult to understand pollution distribution in three dimensions from such discrete measurements due to the measurement time required and low data density.
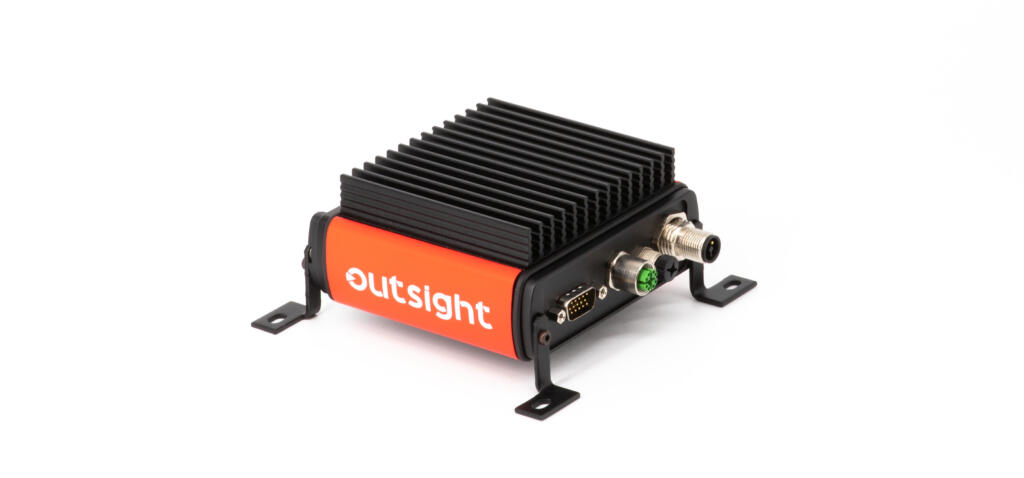
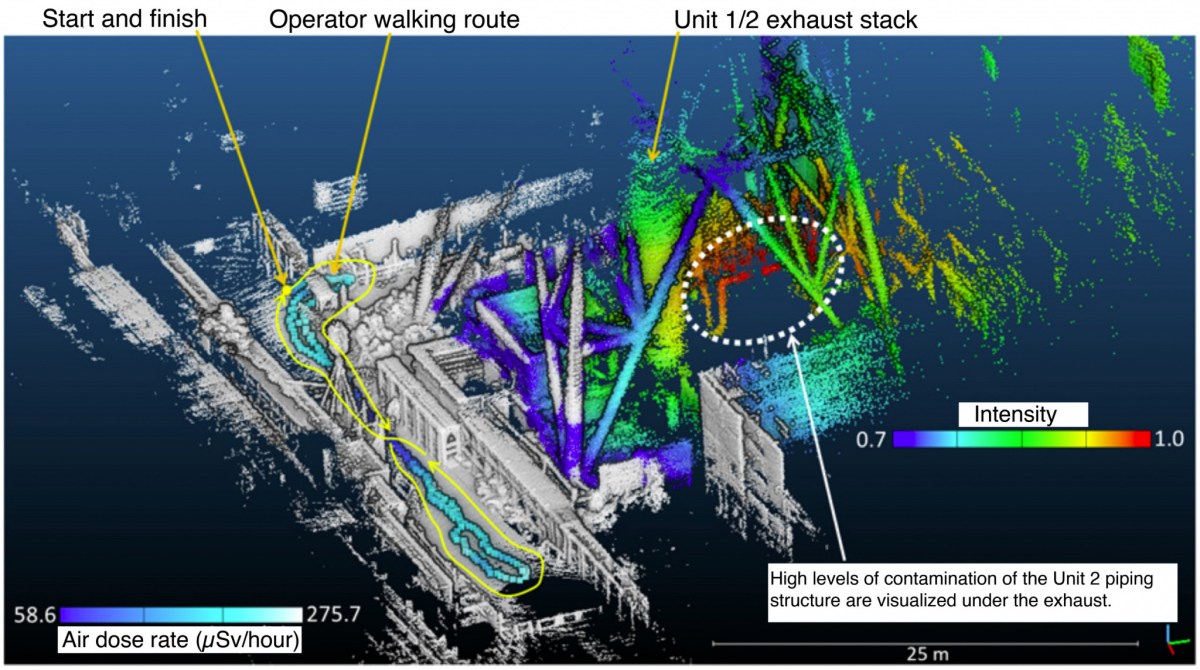
To solve this problem, Japan Atomic Energy Agency (JAEA) developed a way to visualise contaminated areas and air dose rates by combining a Compton radiation camera and Kaarta Stencil 2 three-dimensional portable mapping system. The system, called iRIS, enables the rapid creation of 3D radiation maps. JAEA was able to acquire the data for visualising the contamination distribution near the powers stations Unit 1/2 exhaust stack and the dose rate distribution on the trajectory – the walking route – in less than five minutes, without approaching the contaminated area.
Thematic mapping

Three-dimensional pollution distribution and dose rate distribution can be easily visualised with this approach. It is then possible to simulate the shielding and decontamination effects for reducing the dose rate. JAEA is planning to provide Tokyo Electric Power Company Holdings, Incorporated (TEPCO), and other companies, with this information to plan decommissioning activities and to reduce decommissioning worker exposure within the Fukushima plant.
This is a great example of Kaarta technology being combined with other sensors to create a 3D thematic map. Kaarta recently received a patent covering their novel approach to fuse data captured with SLAM systems with data from other sensors to measure and localise sensed data in the scanned environment.